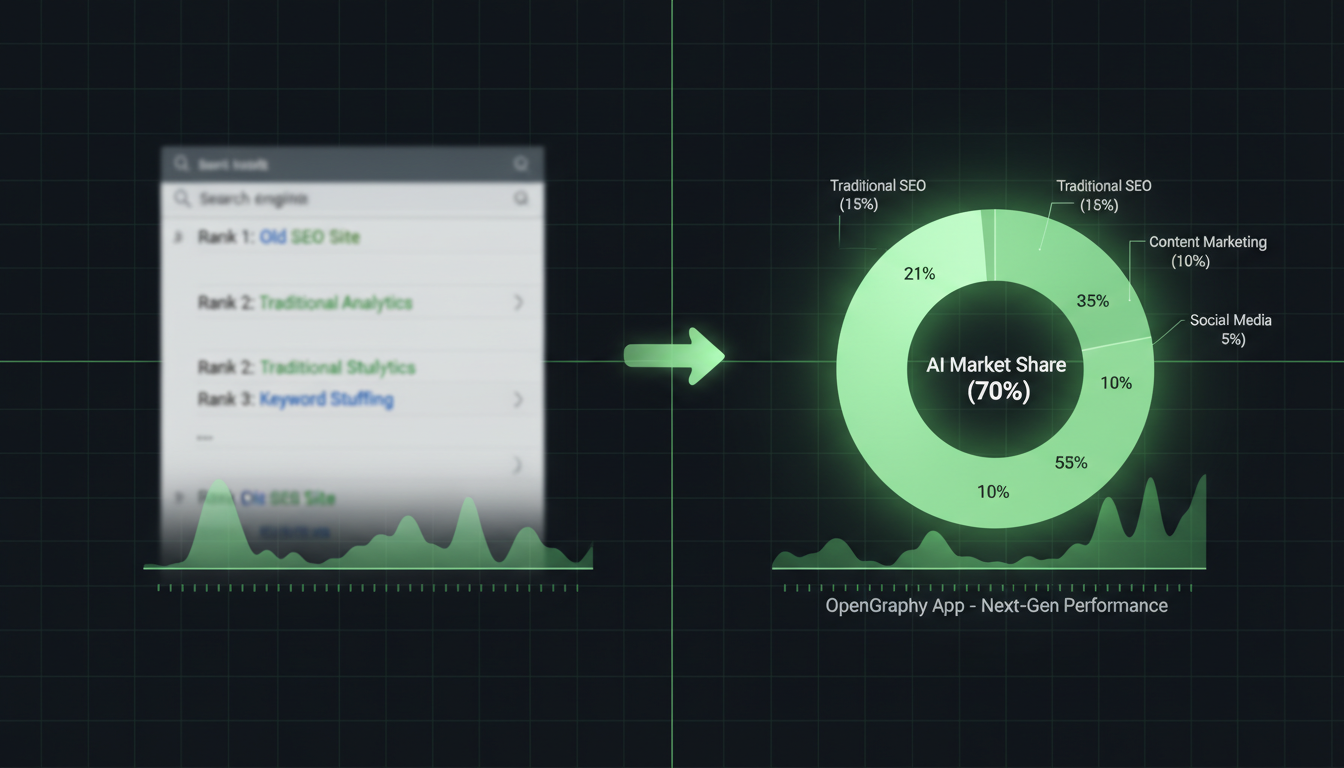
Share of voice measured how often your brand was mentioned vs. competitors in media. Share of search measured your slice of relevant Google queries. Share of Model — the new headline metric — measures how often AI assistants recommend your brand vs. rivals on the queries buyers actually ask.
The metric history is consistent: every time the dominant content surface shifts, a new "share of X" metric emerges to track competitive position on that surface. Magazines gave us Share of Voice. Search engines gave us Share of Search. AI assistants give us Share of Model — and for B2B brands in 2026, it's becoming the headline competitive intelligence metric, ahead of both predecessors in many boardrooms.
This guide covers Share of Model in depth: the precise definition, why it's the right metric for the AI era, how to measure it, the strategies to grow it, and the competitive landscape implications. By the end you should be able to integrate Share of Model into your competitive KPI suite and use it to direct AI-visibility investment.
What Is Share of Model?

Share of Model measures the percentage of AI-assistant responses on category-relevant queries that mention or recommend your brand vs. competitors. Calculated per AI model (ChatGPT, Claude, Gemini, Perplexity) on a curated query set, then aggregated to a single share-of-model figure.
The precise definition
For a defined query set Q (e.g., 50 buyer queries in your category) and a defined competitor set C (e.g., your top 8 named rivals), Share of Model is: your brand's mention count across Q queries × N AI models / total mentions of brands in C across the same matrix. It's a relative metric — your share of total category mentions, not your absolute citation count.
Why a relative metric beats an absolute one
An absolute count (e.g., "we got 47 mentions this week") moves with overall query volume and AI model behavior changes. A relative share isolates your competitive position from those exogenous factors. The OpenGraphy Share of Model dashboard normalizes for both.
How it differs from Share of Voice and Share of Search
Share of Voice tracks media mentions; Share of Search tracks Google query volume related to your brand. Both measure surfaces buyers used to use heavily. Share of Model measures the surface buyers increasingly use for shortlisting and evaluation. Different surface, different metric.
Why It Matters More Than Ever

Three forces have made Share of Model the right headline metric for B2B competitive intelligence in 2026.
Buyer behavior has shifted
50%+ of B2B buyer journeys now include at least one AI-assistant query. By the time a buyer reaches a vendor's website, they've already shortlisted from an AI's recommendations. Being on that shortlist is no longer optional.
Growth is steep and asymmetric
Share of Model gains compound. Brands that invested early in 2024–2025 now sit on durable advantages — schema-rich content, dense knowledge graph footprints, established co-occurrence with category authority. Late entrants face a 12–18 month catch-up cycle to close the gap.
The first-mover window is closing
Each quarter that passes, more competitors notice the metric and invest. The compounding nature of AI-visibility investment means the cost of late entry is rising — not just the absolute work, but the steeper authority curve required to displace established citation patterns. The "AI-SEO is overhyped" position grows harder to defend each quarter.
How to Measure Your Share of Model

Three steps stand up a working measurement program. Most teams complete the setup in 2–3 days.
Step 1 — Define your query universe
30–80 queries that map to your buyer journey: category discovery, comparison/evaluation, use-case-specific, long-tail. Pull from sales call transcripts, support ticket queries, search console data. Real buyer language beats internal vocabulary.
Step 2 — Define your competitor set
5–10 named competitors. Include direct rivals, adjacent-category substitutes, and the latent competitors AI models surfaced in your last latent competitor audit. Review the set quarterly.
Step 3 — Run continuous stress tests
The OpenGraphy Stress Tests feature handles measurement: weekly across all four major AI models, with the resulting data rolled into the Share of Model dashboard. Configure once; the metric updates continuously.
What healthy looks like
For B2B SaaS in competitive categories, 12–25% Share of Model is healthy operating range; 30%+ indicates category leadership; below 8% indicates significant invisibility. Trend direction matters more than absolute level — declining 25% is more concerning than rising 12%.
Strategies to Increase Your Share

Three strategies move Share of Model. Run them in parallel; they compound.
Authoritative content at cadence
Pillar articles that own buyer questions, original research that gets cited externally, comparison content that builds co-occurrence. The cadence matters as much as the quality — irregular shipping reads as a noisy signal to AI models. 2–4 pillar articles per month is the floor for B2B SaaS.
Knowledge graph density
Clean entity definitions, sameAs links to authoritative sources, dense relationship modeling between your brand, products, founders and customers. The OpenGraphy Knowledge Graph Engine visualizes the gaps; the GEO Agent ships fixes. See Knowledge Graph Optimization for Brands.
Topical clusters in cocon-sémantique structure
Pillar plus tightly-linked supporting articles. The cocon structure builds topical authority faster than one-off pillars. Each article reinforces the others; AI models read the cluster as a coherent expertise signal.
The Competitive Landscape

The Share of Model competitive landscape in most B2B categories has the same shape: a small number of brands that invested early hold disproportionate share; the bulk of the category competes for the remaining slice; new entrants face structural barriers. The first-mover advantage is real and growing.
The first-mover window
Brands that built schema-rich content, dense knowledge graphs and authority footprints in 2024–2025 are sitting on durable advantages. Their AI representation is mature; their citation patterns are sticky; their training-data co-occurrence with category authorities is established. Closing that gap takes 12–18 months of consistent investment.
The displacement playbook
Catching a category leader on Share of Model requires three coordinated moves: ship comparison content that pairs your brand with theirs (forcing co-occurrence), build authority signals that the leader hasn't (original research, prominent guest posts), and run continuous stress tests to track displacement progress. Achievable, but requires patience and capital.
The defense playbook
If you're the leader, the cheapest defense is continuing what got you there: authority content cadence, schema maintenance, knowledge graph hygiene. Most leaders lose share by complacency, not by competitor attack.
FAQ: Share of Model Metrics
What is Share of Model?
The percentage of AI-assistant responses on category-relevant queries that mention or recommend your brand vs. competitors. Measured per AI model (ChatGPT, Claude, Gemini, Perplexity) and aggregated. The OpenGraphy Share of Model dashboard tracks it continuously.
How does it relate to Share of Voice?
Share of Voice tracks media mentions. Share of Model tracks AI assistant recommendations. Same metric concept, different surface — the surface that increasingly drives B2B shortlisting.
What's a healthy Share of Model?
For B2B SaaS in competitive categories: 12–25% is healthy operating range, 30%+ is category leadership, below 8% indicates significant invisibility. Normalized across the four major AI models.
How often should I measure?
Weekly for competitive categories, monthly minimum for stable ones. Continuous via the Stress Tests feature.
How do I move it up?
Three coordinated investments: authoritative content at cadence, knowledge graph density, topical cluster structures. The combination compounds; isolated tactics produce marginal lift.
What's the realistic timeline for material change?
3–6 months for early signal, 12–24 months for structural change. AI models update on training and retrieval cycles; the lag is consistent.
Going Further
- Understanding Your AI Visibility Score — the rolled-up KPI that includes share signals.
- Stress Testing Your AI Presence — the measurement methodology.
- How AI Models Reveal Your Hidden Competitors — defining the right competitor set.
- Knowledge Graph Optimization for Brands — the entity layer that compounds share.
- Automating Competitive Research — the continuous monitoring layer.
Ready to put this into action?
Explore our AI Visibility features and start optimizing today