AI models build their answers from internal representations of brands and the relationships between them. A clear, well-structured knowledge graph makes you a confident citation. A messy one makes you a hesitation. The OpenGraphy Knowledge Graph Engine shows you what AI models currently understand about your brand — and how to fix the gaps.
"Knowledge graph" sounds like a back-office concept that should live with the data engineers. In 2026 it's a front-line marketing concern. When ChatGPT says "X is a great alternative for Y" with confidence, the model isn't pulling from a single document — it's reasoning over a graph of entities and relationships it's built from training. The clarity of your brand's representation in that graph determines whether you get cited cleanly or buried with a hedge.
This guide walks through knowledge graph optimization for B2B brands: what a brand knowledge graph is, why it matters for AI visibility, the entity relationships worth optimizing, and the practical steps to clean up your representation across all four major AI platforms. By the end you should be able to audit and improve your brand's knowledge graph footprint methodically.
What Is a Brand Knowledge Graph?

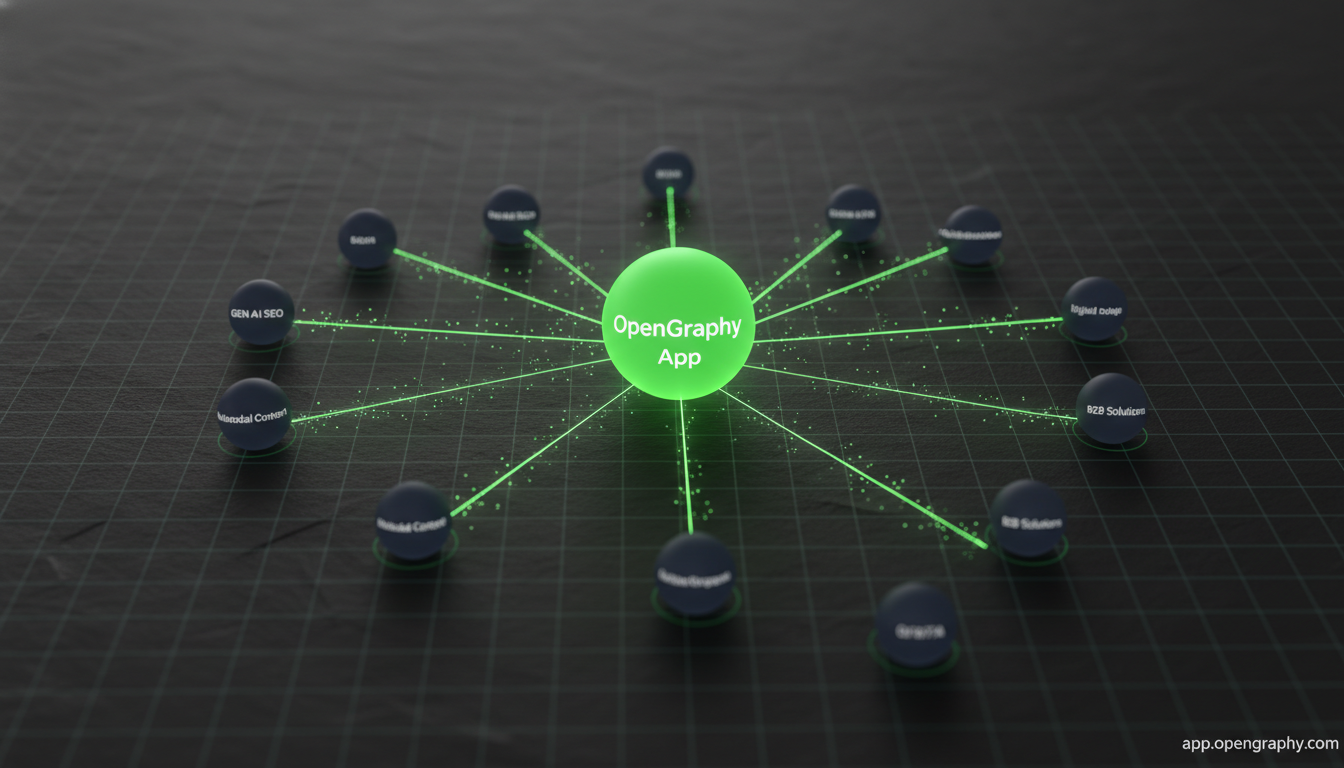
A brand knowledge graph is a structured representation of how your brand relates to concepts, products, people and other entities. The OpenGraphy Knowledge Graph Engine visualizes the network AI models have built around your brand — central node, surrounding entities, edges representing relationships.
The components of a brand knowledge graph
Five entity types matter most. Products — the offerings your brand sells. People — founders, executives, prominent customers. Concepts — the ideas your brand is associated with. Categories — the markets you operate in. Use cases — the jobs buyers use your product for.
Why graphs and not flat descriptions
An AI model could, in theory, build answers from flat brand descriptions. It doesn't, because answers require reasoning across relationships. "What's the best alternative to X?" requires the model to traverse the X→similar-products edge. "Who founded Y?" requires Y→founder. Graphs encode the relationships AI models reason over.
How AI models build your graph
Three primary sources. Wikipedia and structured public sources — high-trust, heavily weighted. Schema-marked structured data on owned web properties — your direct contribution to the graph. Co-occurrence patterns in training corpora — what entities appear alongside your brand in articles, reviews, forums, podcasts.
Why Knowledge Graphs Matter for AI

Without a clear graph, AI models hedge — "Brand X may be a project management tool, possibly used by software teams, sometimes compared to Tool Y." With a clear graph, they commit — "Brand X is a project management tool used by 5,000+ software teams, frequently compared to Tools Y and Z."
Three benefits of a clean graph
Citation confidence — AI models prefer high-confidence entities for citation. A muddy graph means hedged mentions; a clean graph means top-of-list recommendations. Recommendation quality — when models recommend alternatives or comparisons, they reason over the graph. Clearer relationships → cleaner recommendations. Persistence — graph-encoded knowledge persists across model updates better than corpus-level signals. Schema-marked structured data is durable.
The compounding cost of a messy graph
Every additional ambiguity in your brand representation is a friction point that compounds across millions of AI responses per quarter. The opportunity cost of not investing in graph clarity is an order of magnitude larger than the work of investing in it.
Key Entity Relationships to Optimize

Four relationship types matter most for B2B brands. Audit each; close the gaps systematically.
Brand → Category
Make sure AI models associate your brand with the right product categories. Use Schema Markup to define this explicitly via Organization + Product types. Wikipedia infobox alignment matters; so does Crunchbase categorization.
Brand → Features
Document your key features as structured product data. Each feature should appear in product schema, in your owned content (with consistent terminology), and in third-party reviews. Inconsistent feature naming across sources confuses the graph.
Brand → Competitors
Be explicit about where you sit competitively. Comparison content (your brand vs. specific named competitors) helps the model build accurate edges. AI models cite comparison content frequently — especially when buyers ask evaluation queries. See How AI Models Reveal Your Hidden Competitors.
Brand → Use cases
The jobs buyers use your product for. Customer success content, case studies and testimonials drive this edge most. Vague use-case content produces vague graph representations; specific use cases ("project management for distributed engineering teams" vs. "general productivity") produce sharp ones.
Practical Optimization Steps

Four-stage program. Most teams complete the audit in one week and ship the first round of fixes in the next two.
Step 1 — Audit your current Knowledge Graph
Use the Knowledge Graph Engine to see how AI models currently understand your brand. The visualization shows nodes, edges, confidence scores. Print it; circle every wrong or missing relationship.
Step 2 — Identify gaps
Compare your actual positioning with the graph representation. Where are you described inaccurately? Where are key relationships missing? Where do AI models hedge ("possibly," "sometimes")?
Step 3 — Add schema and structured data
For every gap, ship the schema enhancement that fixes it. Organization schema for the brand; Product schema for offerings; Person schema for founders; Article schema with author and citation. See Schema Markup in the AI Era for the full schema-type playbook.
Step 4 — Build authority signals
Schema marks your structured data; authority signals validate it. Wikipedia entry alignment, Crunchbase profile, prominent third-party reviews, industry analyst mentions — these are the high-trust sources AI models weight heavily. Invest in these continuously, not as one-time projects.
Step 5 — Re-audit quarterly
Run the Knowledge Graph Engine each quarter to measure how the graph has evolved. Successful fixes show up as cleaner edges and higher confidence; failed fixes show up unchanged. The audit-fix-measure loop is what compounds graph quality.
FAQ: Knowledge Graph Optimization
What is brand knowledge graph optimization?
The practice of structuring your brand's data, relationships and authority signals so AI models build a clean, confident representation of your brand in their internal knowledge graphs. Different from generic SEO or schema markup — KGO targets the model's reasoning layer specifically.
How is this different from regular SEO?
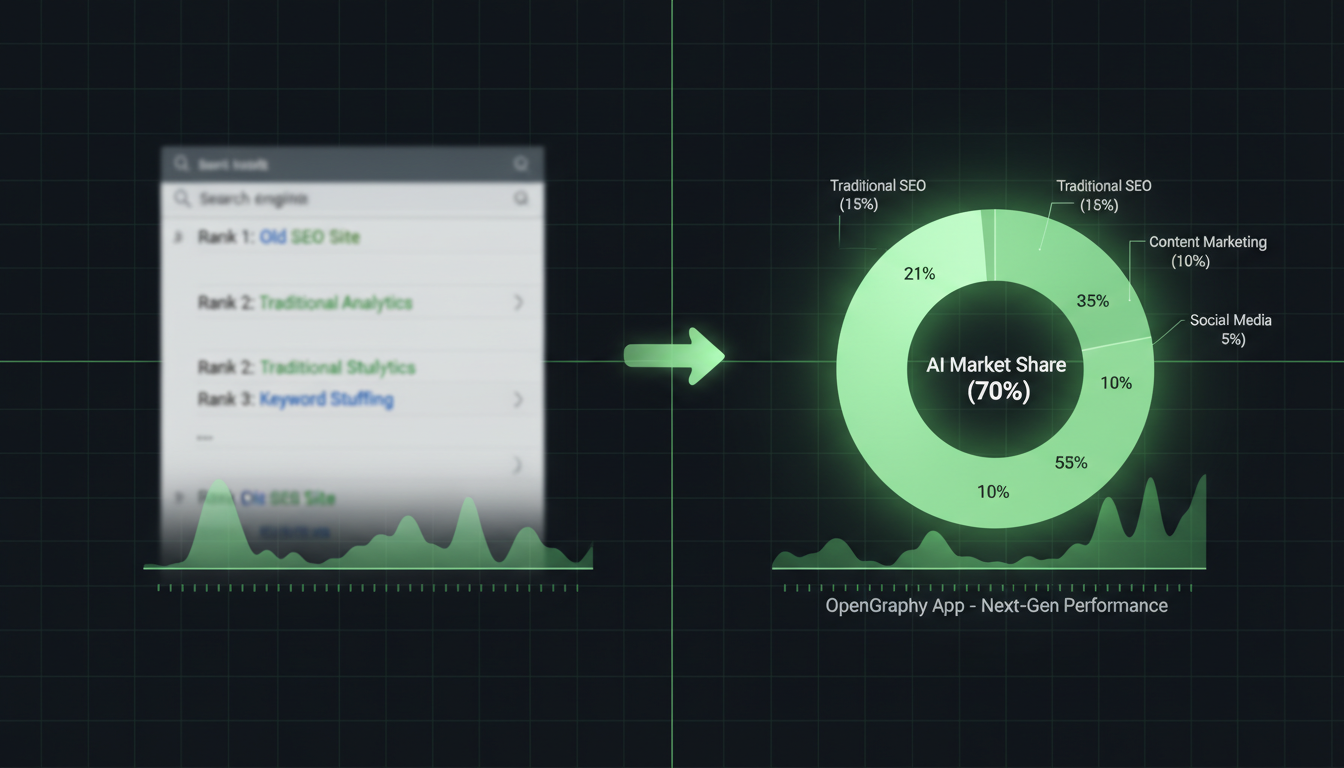
SEO optimizes for search ranking algorithms; KGO optimizes for the entity-and-relationship representations AI models build. Schema markup overlaps both, but KGO emphasizes relationship clarity and authority-source alignment more heavily.
How do I see my current brand knowledge graph?
Use the OpenGraphy Knowledge Graph Engine. It visualizes the entities and relationships AI models currently associate with your brand across the four major platforms.
What if Wikipedia has wrong info about my brand?
Wikipedia entries can be edited, but require reliable third-party sources to support changes. Build the source content first (industry coverage, analyst reports, prominent reviews), then propose the Wikipedia edit. Don't try to edit Wikipedia first.
How long does KGO take to show results?
60–120 days for measurable lift. AI models update their representations on training and retrieval cycles; structured data fixes propagate faster than corpus-level signals.
Do I need an in-house data engineer to do this?
No. The OpenGraphy Knowledge Graph Engine surfaces gaps in plain language; the GEO Agent generates schema fixes; most B2B teams handle the program with their existing content marketing function.
Going Further
- Schema Markup in the AI Era — the schema layer that powers KGO.
- Understanding Your AI Visibility Score — KGO contributes to the authority pillar.
- How to Rank in AI-Generated Lists — the recovery playbook for invisible queries.
- Share of Model: The New Market Share Metric — the headline metric KGO compounds.
- Automating GEO Optimization — the agent that runs KGO continuously.
Ready to put this into action?
Explore our AI Visibility features and start optimizing today